The Brief
UEFA.com asked us to develop new features to engage football fans with the upcoming re-launch of their Statistics area. We pitched a dozen different options, and narrowed the field down to one, Pitch View, for launch in the Champions League 2012-13 season.
UEFA wanted to prioritise attacking play and show the ‘ebb and flow’ of games along with key events. They also wanted visualisations that would live in the match reports, not just in a centralised area.
Our Pitch View app innovates in several areas:
The ‘Attacking Algorithm’ – sense-making in midfield data
The editorial leadership at UEFA wanted Pitch View to overcome the visual noise that hampers many football visualisations.
Most football stats highlight ‘possession’ which is often shown by *All Possession* on the pitch. This leads to visualisations that are too cluttered either from showing every passing line or heat-maps that show the whole pitch covered. We wanted to editorially and visually edit and articulate key moments and locations in the game.
We developed an algorithm that sifts the possession and location data to find the meaningful events. The weighting we developed is based on:
- Proximity to attacking third of pitch
- Moves that end in attack
- A ranking of attacking moves and their locations
This algorithm is typical of how you can build on the data you are provided with to create unique value for a new product.
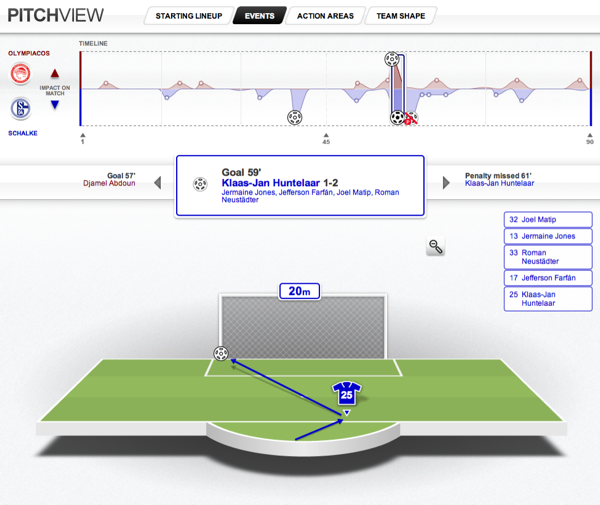
The timeline only shows events that are significant moments in the game – and these are shown on the ‘Events’ view, with more traditional goalmouth views for goals.
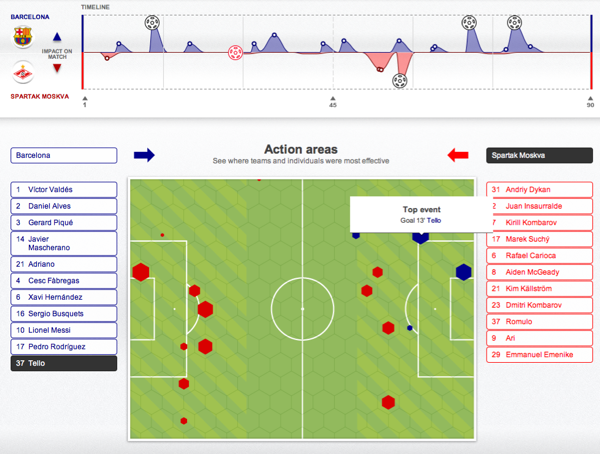
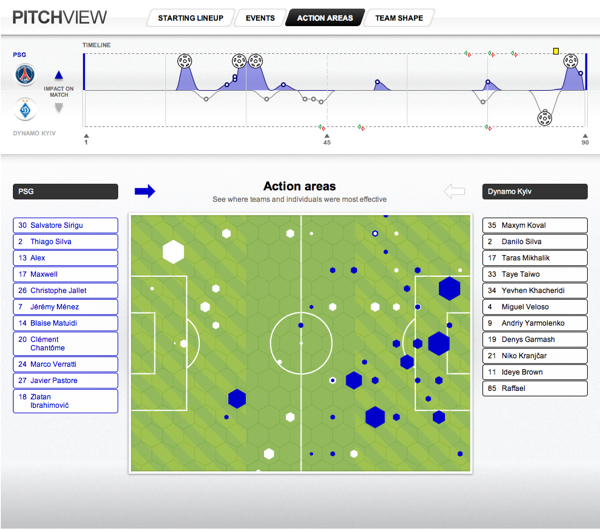
Action Areas – beyond the heat-map
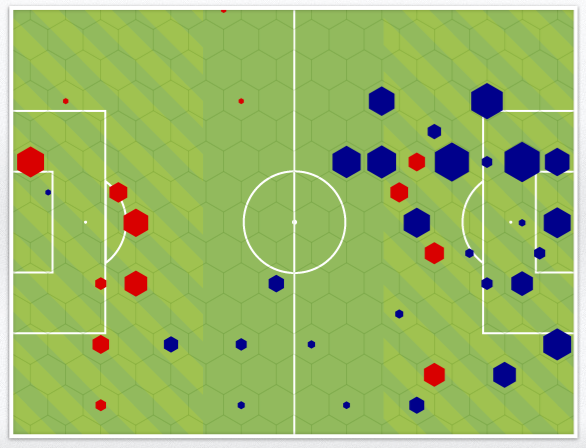
Powered by the algorithm, the Action Areas map shows where effective attacking play took place – rather than where all play took place. We visualized these areas as hexagons, which are more readable than jarring squares and floating circles. The default view is for the whole team, but the player vs player comparisons really show the accuracy. Roll-overs tell you who did what when in which area.
‘Attacking Momentum’ timeline
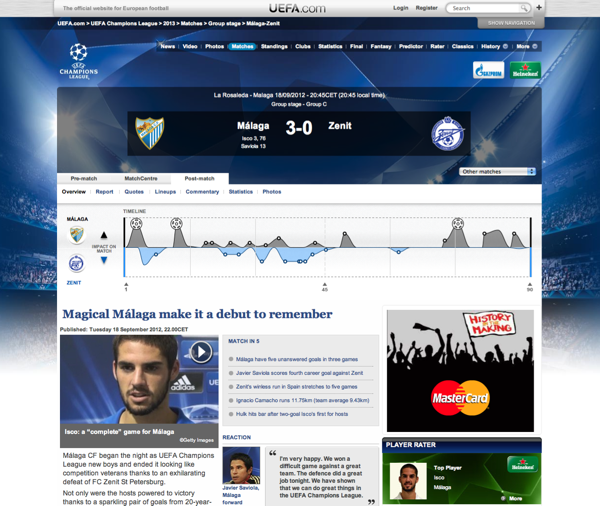
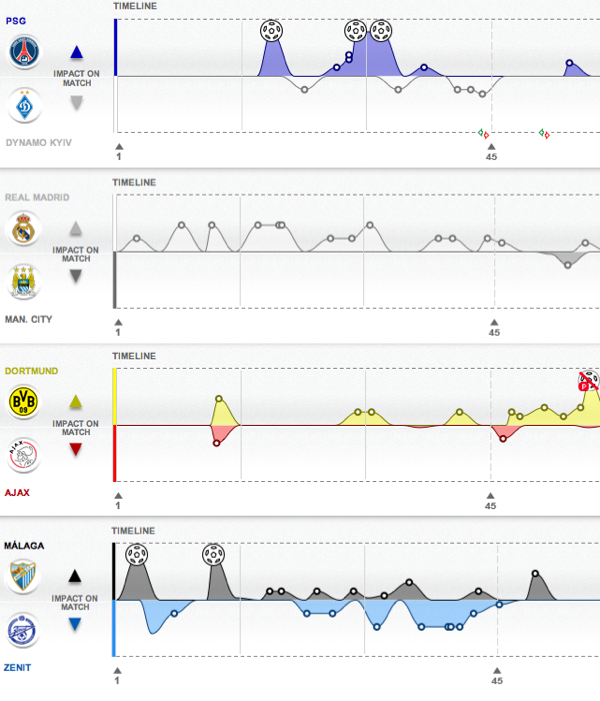
We have built on the previous UEFA timeline, now showing which team is having more attacking impact. The timeline serves to show key moments but also overall ebb and flow of the game. Sports fans all want to know ‘who is winning?’ and this timeline shows the spikes of impact, where one team has had more attacking play than the other.
Team Shape – Parametrics
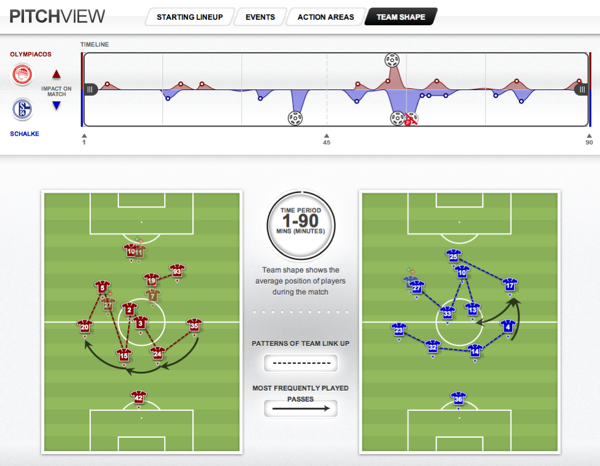
Team shape shows us how teams play in formation. We have kept this one simple to avoid the complexities of the more baroque network visualisations out there but will certainly be looking to so more in this area. (an article here talks about this more)
We also edited down the number of key passes per team in the interests of visual clarity, but will be looking to expand the insights into passing patterns as we iterate.
Partnerships
UEFA.com were great to work with. They have a strong sense of their editorial focus, engaged usability advocates and a mature product culture.
We worked in a three stage process. The first stage is Planning – understanding audience and business/ editorial needs, agreeing the product direction and basic design. This Planning phase is our core strength – bringing together all the forces (audience, data, business needs) to make something unique and engaging.
Second was prototyping where we did most of the work on developing the Attacking Algorithm with real code and finalising designs. Third was Production – regular calls and the iterative dance between tech, design and product management to launch the application.
As well as being our build partner, Made by Pi put considerable effort into project management, UX and collaborating on getting the data to do what we needed it to do. Paul Lemon, their CTO, worked tirelessly with us to get the algorithm for the impact timeline and action areas just right. Loz Gray was also involved – contributing his design and footballing insights to the development phase. It was a great example of how we work - bringing the right people together for each project.
Deltatre are the UEFA area providers and somehow found time to work with us despite also running data for the Euros and Olympics. They were very open to new requirements of their data and collection, where our product features required it.
What Next?
We love football and data products so are looking forward to the next foray into this area. There is plenty to be done on the beautiful game.

