-
What we do
- We make digital products that show visual data.
- We look to uncover the hidden truth in your data
- We design for users and not other designers.
Why ‘After the Flood’?
We believe that a better informed world is a better world for everyone.
Businesses and organizations are flooded with too much data. Data powers our processes, decisions and communications yet it is often presented badly with no thought given to its purpose or audience.
We make digital products and films that provide answers to the questions people have of your data and business, be it sports stats, government dashboards or films about history.
Data Experience Design
Many companies just focus on the visualizations themselves – we also make the context for the visualisations – the apps, web-sites and experiences that people access the data in. We create the entire data experience, making the data usable and useful across a range of platforms. In order to do this, we draw on User Centred Design methods that research users and their needs.
Our methods are a unique fusion of techniques and insights from Information Design, User Experience Design, Market Research, Product Development, Media Production.
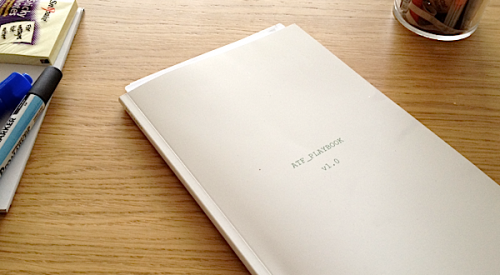
These are catalogued in our Playbook, where we note and develop new methods particular to Data Experience Design.
Engaging and Informing
Your customers, users and shareholders can be engaged with the data you own, by making it into linear, physical, digital or social media experiences. The data you possess can tell fantastic stories, drawing new people in to what you do and allowing others to share these ideas.
Visualising your data helps people understand your products and services better, explaining complex notions and keeping their attention and footfall with your brand.
Corporate and Governmental Transparency
In an age of increased need for transparency and accountability, allowing the public to engage with your data in useful ways will create positive perception and new converts to your cause.
-
The After the Flood Playbook

The After the Flood Playbook is how we record and improve our methods. The playbook is a catalogue of interchangeable, constantly updated frameworks and processes that can be used to solve any problem you have. Currently running at 63 entries, we split categories into roughly three areas:
1 – Understanding
Key to any work we do is understanding your users or your organisation. Our methods for this include:
Novice and Expert
We ask questions of the user base with the basic assumption that people know stuff or do not, that people have time to engage or do not – and so forth. ‘Novice and Expert’ allows us to ask the big questions of your audience. It is especially useful in work for the public as people will be turned off if your content messaging presupposes too much knowledge.
Organisational Cartography
Mapping the differing parts of the business and the relationships between them. We believe that any analytics work will have many different customers within a company – not just those procuring it. By understanding these different needs we can create a product that engages this diverse and demanding audience.
2 – Data
After the Flood builds software and media that is enabled by data. Methods for understanding your data include:
Data Audit
How does your company use data? What decisions does it need to make? Where is the data kept? These and many questions are answered in the Data Audit. Data is the main material we will be building with, be it an internal analytics project or a website for the general public. We seek to understand what data you have and also what you may need.
Making New Data
A current project (launching in 09/2012) is taking our clients current data set – also available to the whole market – and creating new insight from it. By understanding the questions that their customers were really asking, we wrote some new algorithms which in turn made new data that will now feed what will be a totally original data product. (Case study coming up after launch)
3 - Design
The design phase includes many methods to produce something truly original and importantly, doable.
Rapid Prototyping
Software such as Tableau allows instant visualisation of your data, but a successful product also needs to be relevant to the customers needs. Our rapid prototyping methods allow beta versions of analytics systems in a few weeks, using a cycle of quick build, feedback and iteration.
Video Direction
Video is not cheap, but by maximising the best use of good people, we can make excellent media at effective costs. Lessons learned include the best use of scriptwriters and expert advisors, timing the input of sound design and a design feedback loop that allows for constant iteration and visible results.
The above are just a few of the methods we can bring to bear on solving your data- communication issues.
Contact us at
